Debugging Memory Exceptions in Java - Part I
It's been about a year since I published a post. From First Sunday of Advent:
I'll try to post a daily update; hopefully, a new generative piece everyday explaining the logic behind the engineering decisions and what I've learned.
Hahahahaha. Abort, Retry, Fail? (Don't be surprised to see this as a future blog post title 👀). Anywho, you know what they say, don't publicize your goals. Hopefully, this upcoming year, I'll be more honest to myself, but in my defense, I have spent the year accruing a long list of potential blog ideas; the first idea being an elementary post-mortem analysis and presentation of how I debug memory exceptions in Java.
Introduction
My goal is to deliver a brief presentation of how I debug Java memory exceptions in my local environment. I am not going to scrutinize production-grade tools (e.g. YourKit Java Profiler, New Relic, or Java Flight Recorder), though some tools may be used to fix production issues. Essentially, I want to provide some context around Java memory exceptions in terms of how I first encountered and had to debug a problem in my application, the routes explored and tools used to inspect and identify the memory exceptions, and suggestions for mitigating future issues. With any luck, the reader should get a glimpse and a curiosity for how memory works in Java and the tools available so that they'll be able to prevent memory exceptions or find and fix any memory leak errors that may occur.
Table of Contents
Context
I won't go into the business purpose of the application, from here on out referred to as "KnowledgeDB", from which I had to debug memory exceptions due to legal reasons. Better safe than really, really sorry. However, KnowledgeDB is primarily a monolith backed by Spring Boot with a React frontend hosted on RHEL7 instances and supported by Kubernetes (that was a mouthful). Unfortunately, KnowledgeDB would come crashing down every couple months. Our team would wake up in the morning to a couple emails that our application's Spring Boot services were unresponsive. Luckily for us, our frontend was geared to display an error when data retrieval failed, so all our team had to do was restart the Kubernetes pod hosting our backend services.
To avoid further embarrasment and lost value, we wanted to make sure that we understood why our application's services crashed every two to three months. Without understanding the fundamental problem, memory usage stability is not guaranteed and the services will crash eventually.
Identifying the Problem
Before I delve into KnowledgeDB's specific problem, it is worthwile to take a step back and produce a plan of attack. Listed below are a sequence of questions that may help when investigating a memory leak so that we're not shuffling around like headless chickens:
Questions to Ask
- Do I have a memory leak?
- Which classes are leaking?
- What is keeping these objects alive (an instance in the application)?
- Where is it leaking from, or where in the code are these objects created and/or assigned?
Hunting Down the Memory Leak
After inspecting the logs, the stacktrace seemed standard: Exception in thread <thread_name>: java.lang.OutOfMemoryError: Java heap space
Usually, the error is thrown when there is insufficient space to allocate an object in the Java heap. In this case, the garbage collector (GC) cannot make space available to accommodate a new object, and the heap cannot be expanded further. 1
Our initial observations were clear: the exception occurred periodically, around two to three months, and the issue was NOT behavior driven (i.e. if users went to a certain web page or performed a certain operation, the application would halt and catch fire). KnowledgeDB seemed to work as expected until its breaking point. Since our application lived on Kubernetes pods that were not brought down, we hypothesized that our long-lived application may be unintentially holding references to objects which were unable to be garbage-collected, a memory leak.
From the initial observations, our team decided to run the application overnight and investigate the logs to spot irregularities. For example, was garbage collection being performed routinely? Additionally, we wanted to create a unit test(s), or use a load testing tool, to initiate an expensive operation with deterministic memory pressure. If the memory grew proportionally to the number of requests, then the memory leak should be fixable - we would just have to track where in our application code the objects were being created.
Tools
VisualVM and Eclipse MAT
Due to the relatively simple GUI and its integration with IntelliJ, VisualVM is the tool that I've used the most to inspect the performance and quality of my application code.
Java VisualVM enables developers to generate and analyze heap dumps, track down memory leaks, perform and monitor garbage collection, and perform lightweight memory and CPU profiling. 2
In short, VisualVM does a lot to paint a simple picture of the application's performance. On top of it's fundamental abilties, VisualVM can be extended through plugins like Visual GC. Either way, it's a good idea to run VisualVM in the background during local development to have a sense of security that the application is performing as expected.
Anywho, it doesn't take much to get a basic view of your application's memory usage. First, VisualVM is generally found in your JDK's bin folder as jvisualvm.exe. If you're using JDK 9 or greater, you may need to download the executable through the application's website. After starting VisualVM, navigate to the Monitor tab for the appropriate application, and you should see, among a host of other metrics, a graph for memory. After running your application for a while, waiting until it gets to a "stable" state when all initialization is complete, and generating some object creation and deletion by interacting with your application, you should see the memory graph take the form of a sawtooth pattern like below:
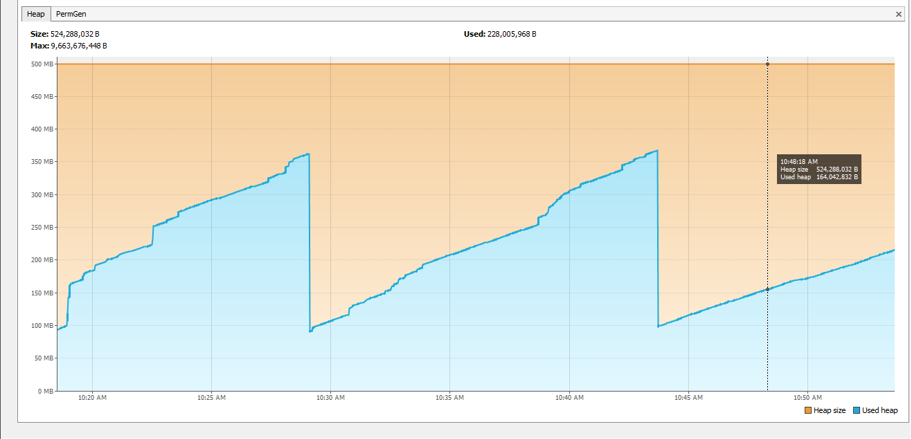
A sawtooth pattern usually denotes a healthy application. Over time, as objects are created through interaction with the application, the used heap will grow. At a certain point, garbage colleciton will kick in, and you'll see a steep drop of memory representing a shift of resources, or deletion of a alot unnessary objects. Please note that different applications render different memory graphs, but overall, you should NOT be seeing the used heap consume the total heap size.
On the otherhand, if you see something like the graph below then you may have stumbled unto a memory leak. There are indications of garbage collection by the small dips, but over time (or in this case, instantly), the used heap grows closer to the heap size. At some point, the heap will not be expanded further, and the garbage collector will not be able to make space available to accommodate a new object.
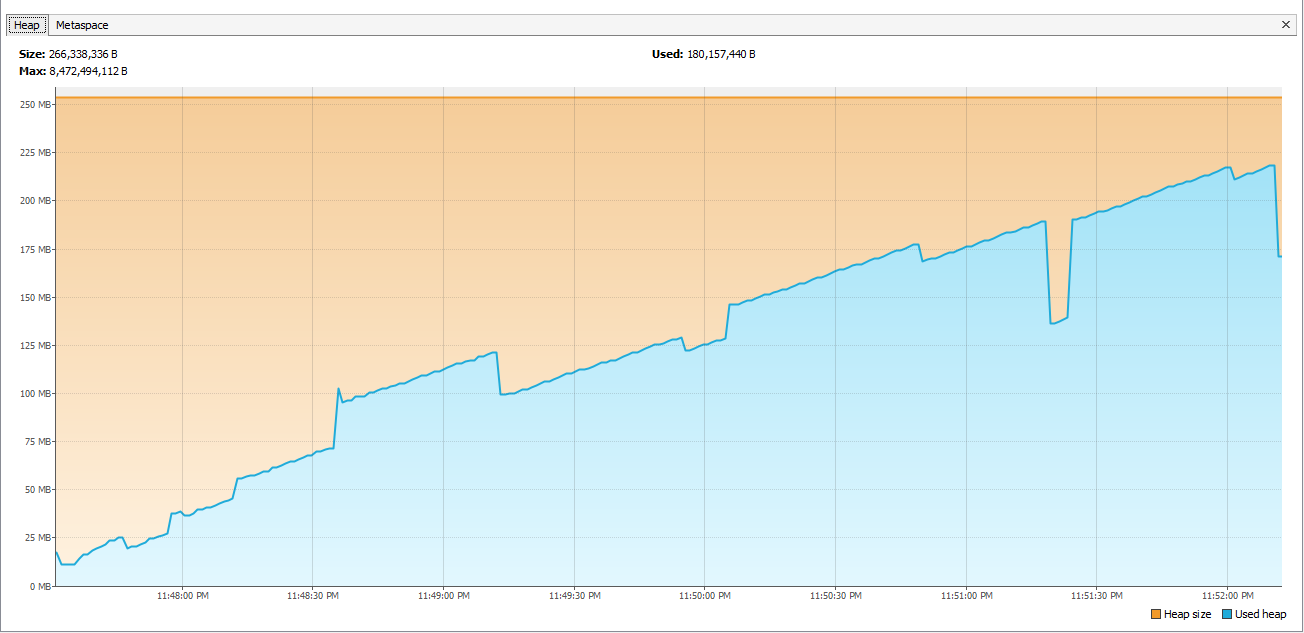
If you encounter a graph like the one above, you've answered your first question: do I have a memory leak? So what now? One more tool you can add to your belt is the Eclipse MAT (Memory Analyzer Tool). By generating a heap dump through Visual VM and loading the HPROF binary-formatted file to Eclipse MAT, you'll be able to investigate the heap, generate reports to check for leak suspects, and analyze objects for suspected memory issues. Tools like Eclipse MAT will be able to help you answer questions 2-4: which classes are leaking and where is it leaking from.
An alternative to generating heap dumps through Visual VM or another tool is to supply the -XX:+HeapDumpOnOutOfMemoryError VM flag when starting your application. This will automatically create a heap dump file when you get an OutOfMemory error. I'll go more into VM arguments in Part II of this series.
gc-logs
If you're opposed to running yet another GUI application in the background, you have the option to turn on verbose garbage collection logs for an application. By default, the GC log is written to stdout, but my recommendation is to provide a log file path and tail those logs while the application is running by using the following commands: tail -f <gc-log-file-path> in Unix or Get-Content <gc-log-file-path> -Wait in Powershell. GC logging can be enabled by passing the below VM arguments during application startup:
# Pre-Java 9
-verbose:gc -XX:+PrintGCDetails -Xloggc:<gc-log-file-path>

# Java 9+
-Xlog:gc*:file=<gc-log-file-path>

# Java 9+ on Windows
-Xlog:gc*:file=\"<gc-log-file-path>\"
I've attached a GC log from a sample application exposing a soft memory leak below:
[0.008s][info][gc,heap] Heap region size: 1M
[0.014s][info][gc     ] Using G1
[0.015s][info][gc,heap,coops] Heap address: 0x00000000f0600000, size: 250 MB, Compressed Oops mode: 32-bit
[7.665s][info][gc,start     ] GC(0) Pause Young (Normal) (G1 Evacuation Pause)
[7.665s][info][gc,task      ] GC(0) Using 8 workers of 8 for evacuation
[7.670s][info][gc,phases    ] GC(0)   Pre Evacuate Collection Set: 0.0ms
[7.670s][info][gc,phases    ] GC(0)   Evacuate Collection Set: 3.7ms
[7.670s][info][gc,phases    ] GC(0)   Post Evacuate Collection Set: 0.5ms
[7.670s][info][gc,phases    ] GC(0)   Other: 0.5ms
[7.670s][info][gc,heap      ] GC(0) Eden regions: 24->0(22)
[7.670s][info][gc,heap      ] GC(0) Survivor regions: 0->3(3)
[7.670s][info][gc,heap      ] GC(0) Old regions: 0->5
[7.680s][info][gc,heap      ] GC(0) Humongous regions: 0->0
[7.680s][info][gc,metaspace ] GC(0) Metaspace: 13689K->13689K(1062912K)
[7.680s][info][gc           ] GC(0) Pause Young (Normal) (G1 Evacuation Pause) 24M->7M(250M) 14.694ms
[7.680s][info][gc,cpu       ] GC(0) User=0.08s Sys=0.05s Real=0.01s

...

[193.490s][info][gc,task       ] GC(8) Using 7 workers of 8 for full compaction
[193.491s][info][gc,start      ] GC(8) Pause Full (System.gc())
[193.491s][info][gc,phases,start] GC(8) Phase 1: Mark live objects
[193.517s][info][gc,stringtable ] GC(8) Cleaned string and symbol table, strings: 6885 processed, 19 removed, symbols: 46529 processed, 50 removed
[193.517s][info][gc,phases      ] GC(8) Phase 1: Mark live objects 26.231ms
[193.517s][info][gc,phases,start] GC(8) Phase 2: Prepare for compaction
[193.526s][info][gc,phases      ] GC(8) Phase 2: Prepare for compaction 8.657ms
[193.526s][info][gc,phases,start] GC(8) Phase 3: Adjust pointers
[193.538s][info][gc,phases      ] GC(8) Phase 3: Adjust pointers 12.709ms
[193.538s][info][gc,phases,start] GC(8) Phase 4: Compact heap
[193.550s][info][gc,phases      ] GC(8) Phase 4: Compact heap 11.137ms
Although not as pretty as it's visual counterparts, GC logs are rich with information. For instance, the second line, [0.014s][info][gc ] Using G1, lets us know that our application is running with the Garbage-First (G1) collector, a mostly concurrent collector that trades processor resources (which would otherwise be available to the application) for shorter major collection pause times. In addition to providing times used by the GC and system calls, the logs provide us with the lifecycle of the collection process. For a more in-depth overview of interpreting these logs, visit Baeldung's Verbose Garbage Collection in Java.
By finding an understanding of the GC logs, you should be able to determine whether the Full GC is executed too often (denoted by Pause Full (System.gc())), takes too much time, or isn't releasing enough memory, all leading to a possible memory leak. For example, by using the Unix awk command to pattern match against my file (awk '/Pause Full/' <gc-log-file-path>) and investigating the provided timestamps in the log, it becomes incredibly obvious that Full GC runs too often:
[193.491s][info][gc,start      ] GC(8) Pause Full (System.gc())
[193.551s][info][gc             ] GC(8) Pause Full (System.gc()) 166M->109M(250M) 59.934ms
[358.239s][info][gc,start       ] GC(22) Pause Full (G1 Humongous Allocation)
[358.341s][info][gc             ] GC(22) Pause Full (G1 Humongous Allocation) 232M->201M(250M) 101.651ms
[358.351s][info][gc,start       ] GC(26) Pause Full (G1 Humongous Allocation)
[358.440s][info][gc             ] GC(26) Pause Full (G1 Humongous Allocation) 234M->212M(250M) 89.249ms
[358.447s][info][gc,start       ] GC(28) Pause Full (G1 Humongous Allocation)
[358.542s][info][gc             ] GC(28) Pause Full (G1 Humongous Allocation) 234M->223M(250M) 94.991ms
[358.567s][info][gc,start       ] GC(31) Pause Full (G1 Humongous Allocation)
[358.667s][info][gc             ] GC(31) Pause Full (G1 Humongous Allocation) 234M->212M(250M) 99.767ms
[432.599s][info][gc,start       ] GC(40) Pause Full (G1 Evacuation Pause)
[432.699s][info][gc             ] GC(40) Pause Full (G1 Evacuation Pause) 249M->232M(250M) 100.122ms
[447.886s][info][gc,start       ] GC(43) Pause Full (G1 Evacuation Pause)
[447.987s][info][gc             ] GC(43) Pause Full (G1 Evacuation Pause) 247M->239M(250M) 101.362ms
[456.809s][info][gc,start       ] GC(45) Pause Full (G1 Evacuation Pause)
[456.898s][info][gc             ] GC(45) Pause Full (G1 Evacuation Pause) 246M->243M(250M) 89.939ms
[458.416s][info][gc,start       ] GC(48) Pause Full (G1 Evacuation Pause)
[458.503s][info][gc             ] GC(48) Pause Full (G1 Evacuation Pause) 245M->244M(250M) 87.247ms
[462.189s][info][gc,start       ] GC(50) Pause Full (G1 Evacuation Pause)
[462.279s][info][gc             ] GC(50) Pause Full (G1 Evacuation Pause) 247M->246M(250M) 89.781ms
Please note that it is always a good idea to enable GC logging, even in production environments, to facilitate detection and troubleshooting of memory issues as they occur.
To Be Continued
In order to make this blog post more digestible (...and keep me grounded and focused), I have decided to break the content into multiple parts. In this post, I described the framework that I find helpful for thinking about memory leak issues and the initial steps I take to mitigate those issues. I want to emphasize that I’m just sharing what works for me — there are different kinds of memory leaks so it seems reasonable that there would be other methods to debugging memory issues.
In the next post in this series, I will focus on other resources in debugging memory leaks: using netstat to find memory leaks associated to resource connections, inspecting jcmd class heap dumps to find classes that may be leaking, etc. Additionally, I will touch on the key takeaways from my experience in debugging these issues in production environments respective to how I structure and debug code and setup my tooling locally.